on
Adding Axis Titles to DojoX Charts
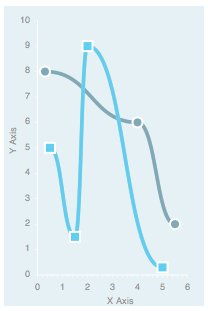
DojoX charting is a very powerful 2D graphics charting solution that works cross-browser. One thing that is an often requested feature is axis titles. I’ve come up with a solution (inspired by a post on the old Dojo forums) that leverages the current API and renders correctly in all browsers. I’ll be using Dojo 1.5 from Google’s CDN plus a local module as I outlined in my local module with a CDN build tutorial.
my/Chart2D.js
dojo.provide("my.Chart2D");

dojo.require("dojox.charting.Chart2D");

dojo.declare("my.Chart2D", dojox.charting.Chart2D, {
	render: function(){
		this.inherited(arguments);
		var axes = this.axes,
			theme_tick = this.theme.axis.tick,
			theme_font = theme_tick.font,
			theme_font_color = theme_tick.fontColor,
			dim = this.dim,
			offsets = this.offsets,
			x_middle = (dim.width / 2) + (offsets.l / 2),
			y_middle = (dim.height / 2) - (offsets.b / 2),
			m = dojox.gfx.matrix;

		// For each axis defined, loop through, check if there
		// is a 'title' property defined.
		for(var i in axes){
			var axis = axes[i];
			if(axis.opt.title){
				var x, y,
					rotate = 0;

				// If the axis is vertical, rotate it
				if(axis.vertical){
					rotate = 270;
					y = y_middle;
					x = 12;
				}else{
					x = x_middle;
					y = dim.height - 2;
				}

				// Render the text in the middle of the chart
				var elem = axis.group.createText({
					x: x_middle,
					y: y_middle,
					text: axis.opt.title,
					align: 'middle'
				});

				// Set the font and font color
				elem.setFont(
					axis.opt.font || theme_font
				).setFill(
					axis.opt.fontColor || theme_font_color
				);

				// If the axis is vertical, rotate and move into position,
				// otherwise just move into position.
				if(rotate){
					elem.setTransform([
						m.rotategAt(rotate, x_middle, y_middle),
						m.translate(0, x - x_middle)
					]);
				}else{
					elem.setTransform(m.translate(0, y - y_middle));
				}
			}
		}
	}
});
This is pretty straight-forward: the code figures out where the middle of the axes are and places the title there, rotating if necessary. I’ll point out one important part: the text must initially be created in the middle of the chart and then translated into position. If the text is created where it should be placed, WebKit-based browsers will hide the vertical axis' title because it initially renders partially off-screen.
You use this new class exactly like you would use dojox.charting.Chart2D, except that each axis can now be passed a title attribute:
new my.Chart2D('chartNode').
	setTheme(dojox.charting.themes.PlotKit.cyan).
	addPlot("default", {
		type: "Default",
		lines: true,
		markers: true,
		tension: 2
	}).
	addAxis("x", {
		title: 'X Axis',
		min: 0,
		max: 6,
		majorTick: { stroke: "black", length: 3 },
		minorTick: { stroke: "gray", length: 3 }
	}).
	addAxis("y", {
		title: 'Y Axis',
		vertical: true,
		min: 0,
		max: 10,
		majorTick: { stroke: "black", length: 3 },
		minorTick: { stroke: "gray", length: 3 }
	}).
	addSeries("Series A", [
		{ x: 0.5, y: 5 },
		{ x: 1.5, y: 1.5 },
		{ x: 2, y: 9 },
		{ x: 5, y: 0.3 }
	]).
	addSeries("Series B", [
		{ x: 0.3, y: 8 },
		{ x: 4, y: 6 },
		{ x: 5.5, y: 2 }
	]).
	render();
I’ve posted a live example, a tarball, and a zip file for download. As you can see, DojoX charting is quite powerful on its own but is easily extensible.
